Production monitoring
Production monitoring is currently in preview and under active development.
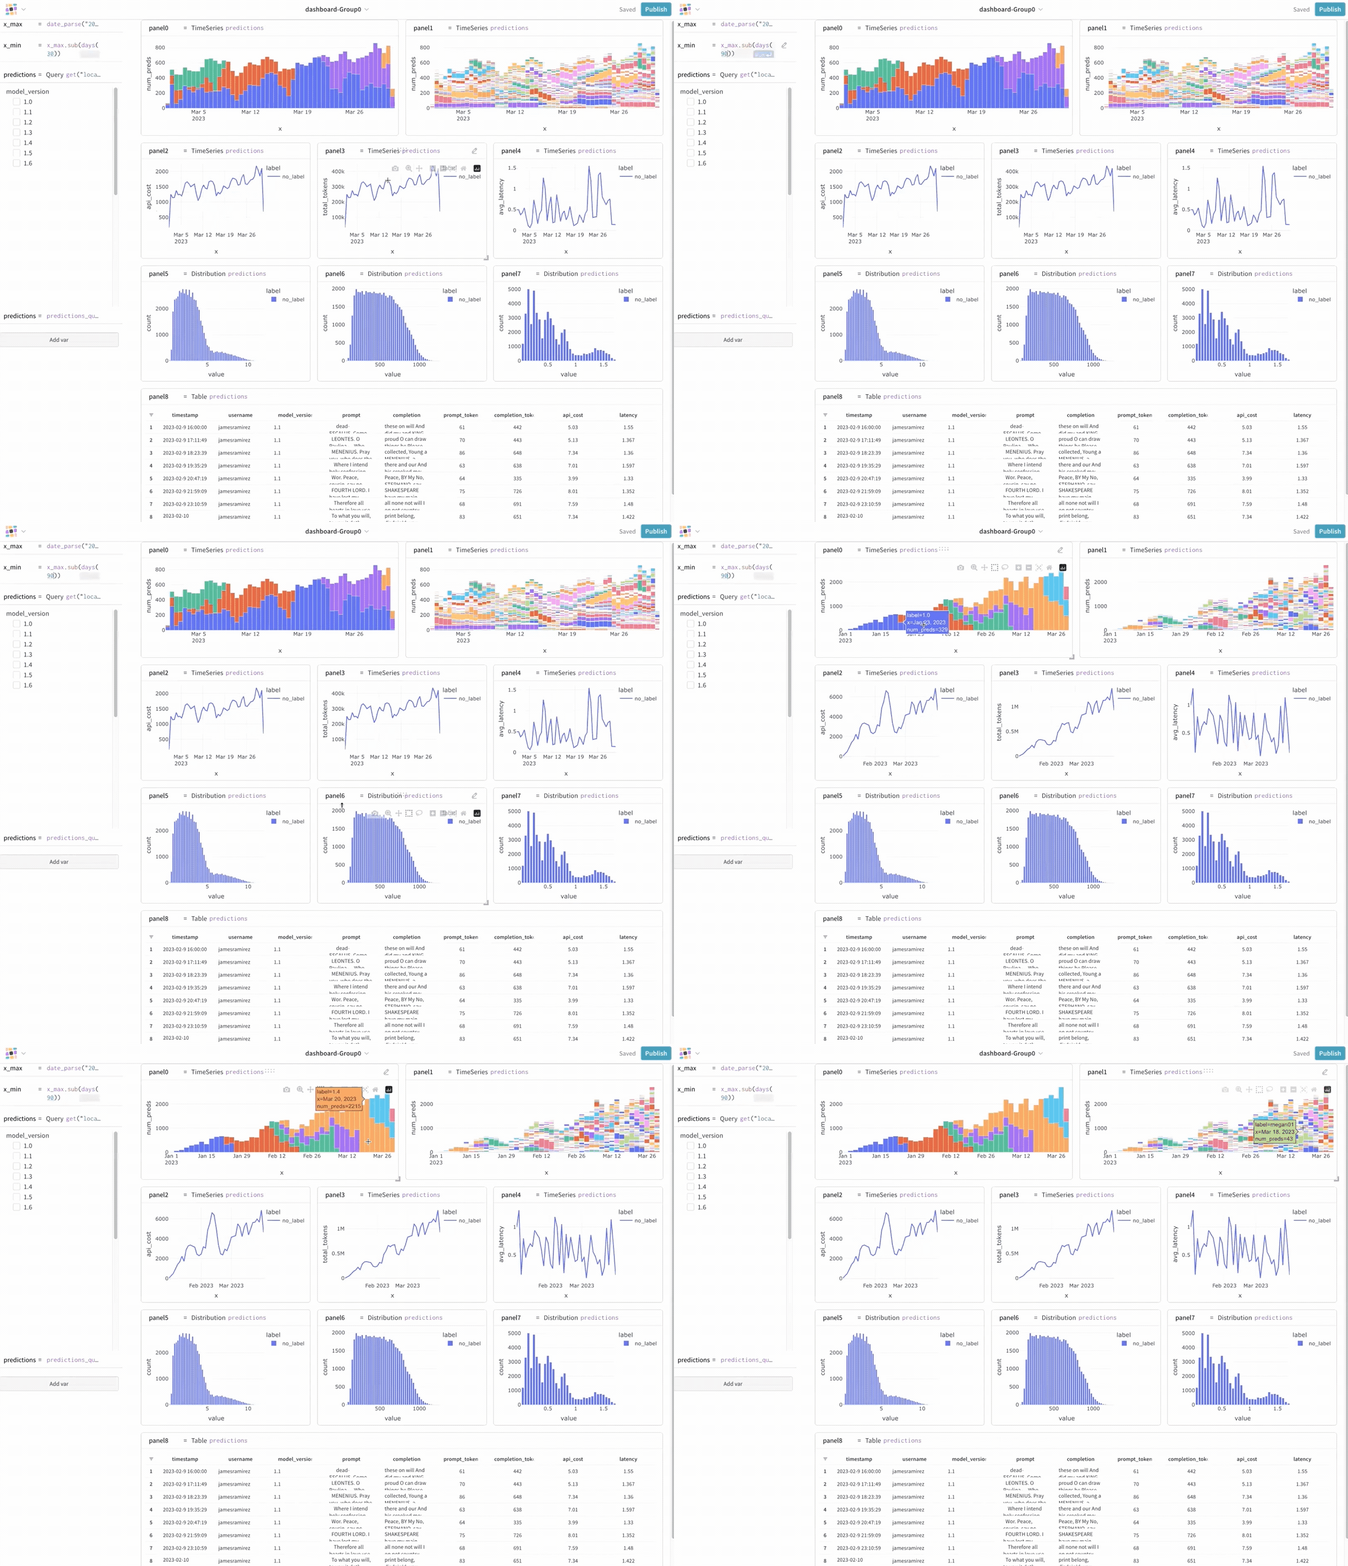
Production monitoring for AI means real-time observability and analytics for any models served from your application. For models deployed to production, monitoring tools and dashboards help track key performance metrics like query rates and latency and enable interactive analytics around model prediction quality and trends, patterns of errors or edge cases, data drift, etc.

How do I use W&B to monitor models?
W&B offers a data management service to compliment the open source Weave project. You can stream live data (and/or save batch tables) in any schema that makes sense for your use case and workflow—like a no-setup database, without the SQL. This approach is effective for tracking and visualizing live production queries, model predictions, dynamic evaluation metrics, user feedback, and more.
Get started in two steps:
- Log data using the Weave StreamTable API
- Seed a Weave Board from the UI
Weave StreamTable API
from weave.monitoring import StreamTable

table = StreamTable("prodmon_demo")
for i in range(100):
    table.log({"_id": i, "text": "hi " + str(i), "img": gen_image()})
Read more about the Weave StreamTable API
Try a simple interactive example in a Jupyter notebook
StreamTables features
- Persisted and secured in W&B
- Columnar storage for efficient queries
- Any arbitrary data shape
- Custom, non-primitive types (e.g, images)
- Supports multiple parallel clients writers
- Automatically track log time
Weave Monitor Decorator
from weave.monitoring import monitor


@monitor()
def ask_llm_calculator(prompt, question):
    return agent.run(prompt + " " + question)


ask_llm_calculator(
    "Please accurately answer the following question:", "Find the square root of 5.4"
)
Weave Monitor Decorator features
- tracks inputs, outputs, latency, timestamp, & exceptions.
- supports pre- and post- processing of inputs and outputs
- able to add data to rows after execution
Try an interactive example: monitoring an MNIST model with live user feedback in a Jupyter notebook