StreamTable
Log and explore some basic StreamTables in an interactive notebook.
- A Weave StreamTable object enables continuous streaming of data from an application or service to W&B
- Append data repeatedly to the same StreamTable object with
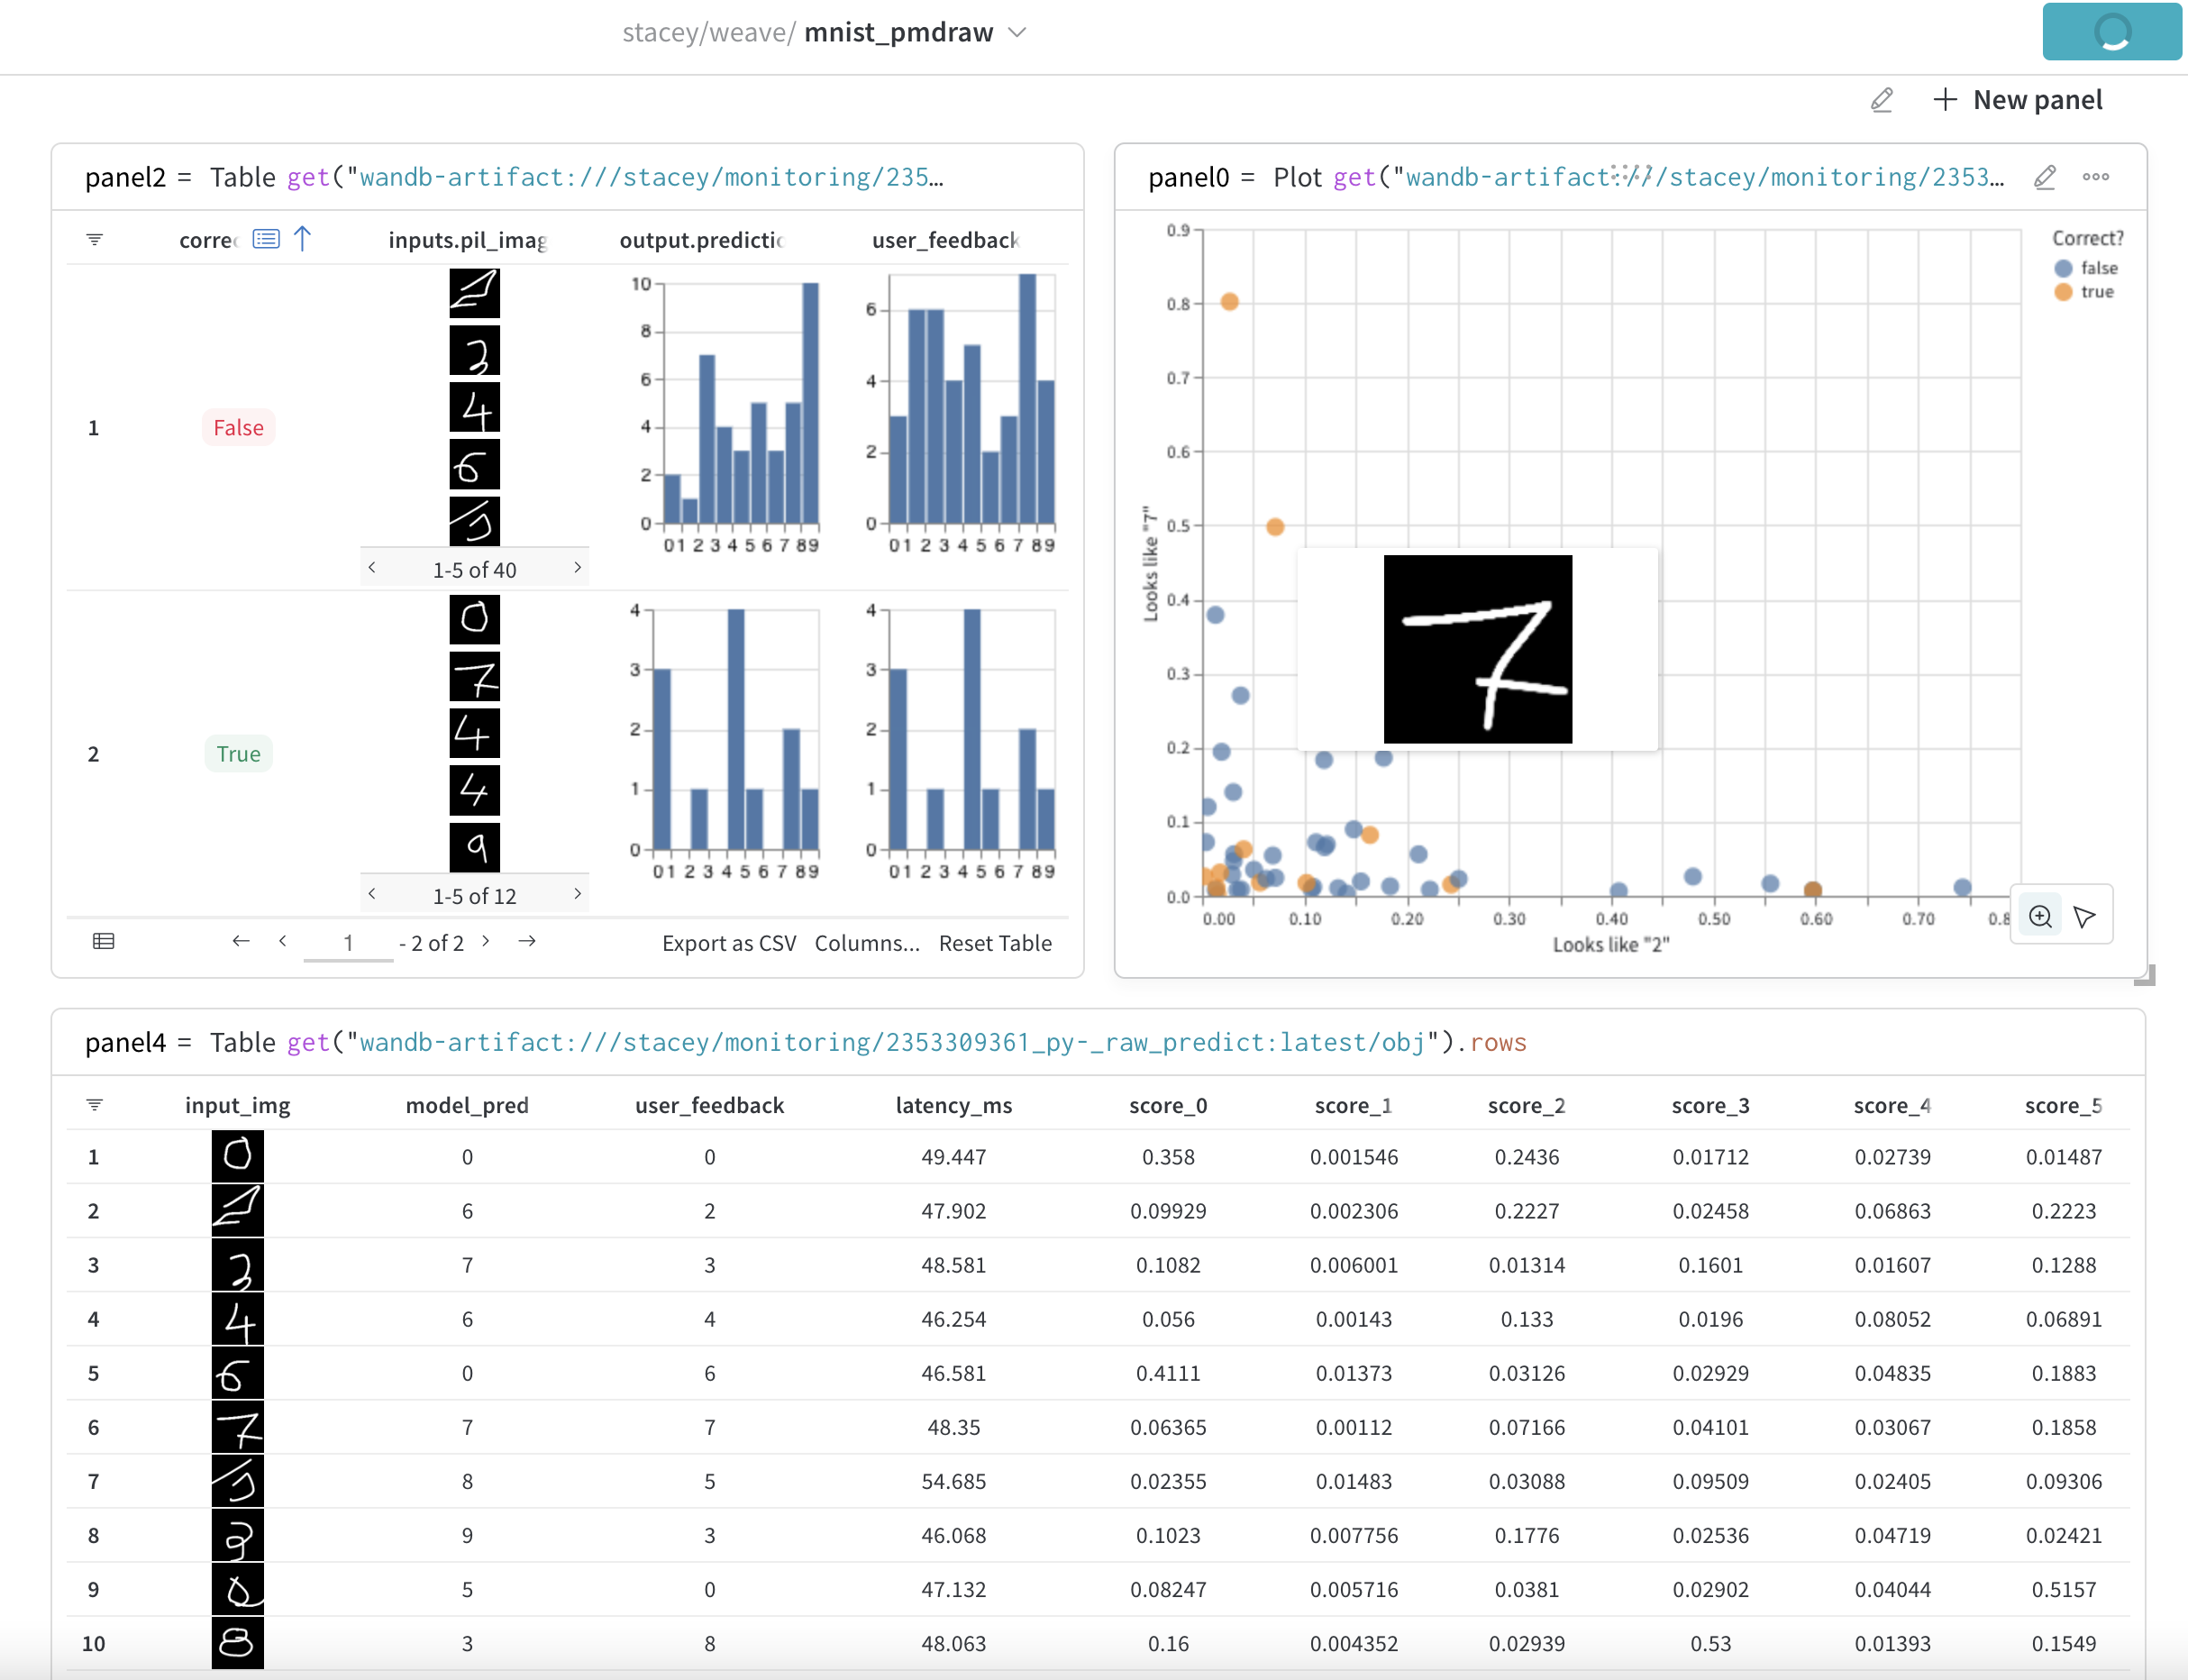
.log([your data rows]) - Build dynamic visualizations from the streaming data, like this example to recognize MNIST digits with live user feedback.
StreamTable Usage
Create a StreamTable
The only required argument to create a StreamTable is the name of the StreamTable object.
from weave.monitoring import StreamTable

st = StreamTable("my_entity_name/my_project_name/my_table_name")
If an entity (W&B username or shared team name) is not provided, this will attempt to default to the current logged-in entity.
Log data to a StreamTable
Call .log() to add rows to a StreamTable:
st.log({"one_column_name": "value_a", "another_column_name": 7})
st.log(
    [
        {"one_column_name": "value_b", "another_column_name": 19},
        {"one_column_name": "value_c", "another_column_name": 28},
        {"one_column_name": "value_d", "another_column_name": 36},
    ]
)
.log() accepts a single dictionary or a list of dictionaries, where each dictionary entry corresponds to one row of the table. In each dictionary, the keys are column names and the values are the corresponding cell values.
Visualize the StreamTable
The first call to .log() will return a Weave Panel URL, where you can view, edit, and save the resulting StreamTable as a Weave Board
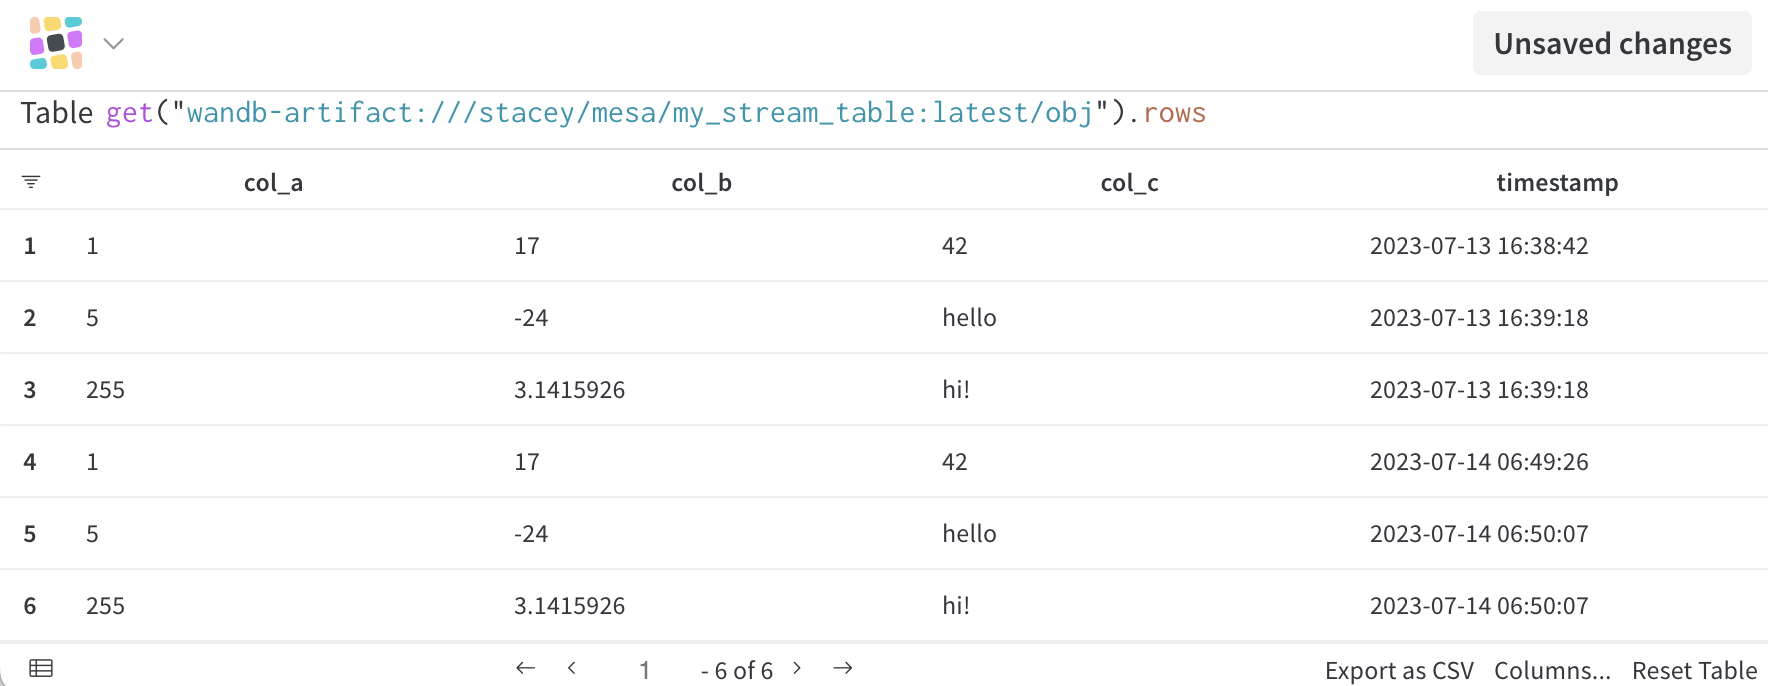
In a notebook, the StreamTable variable on a line by itself will return a Weave Panel view of the StreamTable. The StreamTable will contain all the logged columns and their values, as well as a timestamp column indicating when the row was logged. By default, rows will be ordered by oldest first. You can modify a StreamTable Panel from the UI to sort by columns, group by column values, filter for specific ranges or values, etc and save it as a Weave Board.
Keep streaming data
Continue logging as much data as you like! If you save the StreamTable Panel as a Board, the Board will continue to update as you send more data to the same StreamTable instance.
StreamTable API Reference
StreamTable()
Create a StreamTable by providing a table name, with W&B entity (username or team name) and W&B project as prefixes (in the form entity_name/project_name/table_name) or separate arguments.
StreamTable(
  table_name: str,
  project_name: typing.Optional[str] = None,
  entity_name: typing.Optional[str] = None
)
.log()
Append rows to the SteamTable. Each row is a dictionary, and .log() accepts a single dictionary or a list of dictionaries.
st = StreamTable("stream_table")
st.log({"col_A": 10, "col_B": "x"})
st.log([{"col_A": 20, "col_B": "y"}, {"col_A": 30, "col_B": "z"}])
.rows()
Add this Weave op to the expression at the top of a Weave Panel to show the contents/actual rows of a StreamTable. Without this op, a StreamTable Panel in the UI will only display the entity, project, and table names (and not the row contents of the StreamTable object).
.finish()
Call .finish() to block the user process until all rows and data have been uploaded successfully. This will also wait to display a StreamTable Panel in the notebook UI until all the .log() calls have completed (including any downstream processes, e.g. to compute the values of the rows) and have finished writing to the StreamTable instance. Note that the weave.wandb.ai URL will still show a snapshot of your data at the time it finishes loading — you may need to refresh the page to get all the rows.